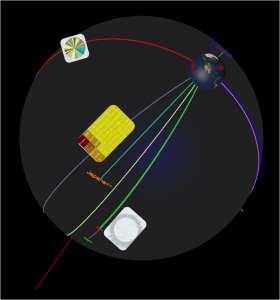
I’ve been pushing hard for a demo at Hadoop Summit this week, waking unexpectedly at 5 AM this morning with spherical trigonometry percolating through my head. The topic is “semantic zooming” and it is not a complicated concept to understand because we have a common example that many of us use daily: Google Maps. All the modern, online mapping systems do semantic zooming to a degree when they change the types of information that are displayed on the map depending on the zoom level. Thus, the “semantics” or “meaning” of the displayed information changes with zooming, revealing states, then rivers, then major roads, then minor roads, and then all the way down to local businesses. The goal of semantic zooming is to manage information overload by managing semantics.
In my case, I’m using a semantic zooming interface to apply different types of information visualizations to data resources in a distributed file system (a file system that spans many disk drives in many computers) related to the “big data” technology, Hadoop. A distributed file system can have many data types (numerical data, text, PDFs, log files from web servers, scientific data) and the only way to interact with the data is through a command-line or through fairly simple web-based user interfaces that act like crude file system browsers. Making use of the data in the system, analyzing it, requires running analysis processes on it, then pulling the data out and importing it into other technologies like Excel or business intelligence systems to bind charting and visualization tools to it. With semantic zooming operating directly on the data, however, the structure of the data can be probed directly and the required background processes launch automatically to create new aggregate views of the data. The end result is an entirely new way of looking at complex data resources.
How does it work? The system uses a spatial metaphor to represent the tree-like structure of the distributed file system. It runs in a browser using the new WebGL standard for high-performance 3D graphics that supports combining the native capabilities of graphics cards with web page rendering. WebGL isn’t pervasive yet, but works well in Google Chrome and acceptably in Firefox. I even tried a hack for making it work on my iPad 3, recently, with mixed success. More work is needed before most WebGL systems will run on iPads. To enable changing semantics, the browser is constantly requesting information from a proxy web service about the distributed file system. As users apply different data lenses (pie chart, bar chart, social network graph, etc.) to the data elements, the distributed processing engine generates new aggregate views of the underlying data.